![]()
Introduction
This Donations Manager application can be used by charitable organizations to manage the processing of donations as well as ensure accurate data entry and seamless communications with donors. In addition, we will include a donation summary report with charts in our application.
Download Complete Source Code
System Requirements
- PHP 5.3+
- MySQL or MariaDB
- phpGrid
- phpChart
Database Overview
Our Donation Manager system has four objects.
- Donor – Personal information about the donor.
- Donation – The amount donated for a particular campaign
- Campaign – Donation campaign information
- Organization – The organization that manages the donations
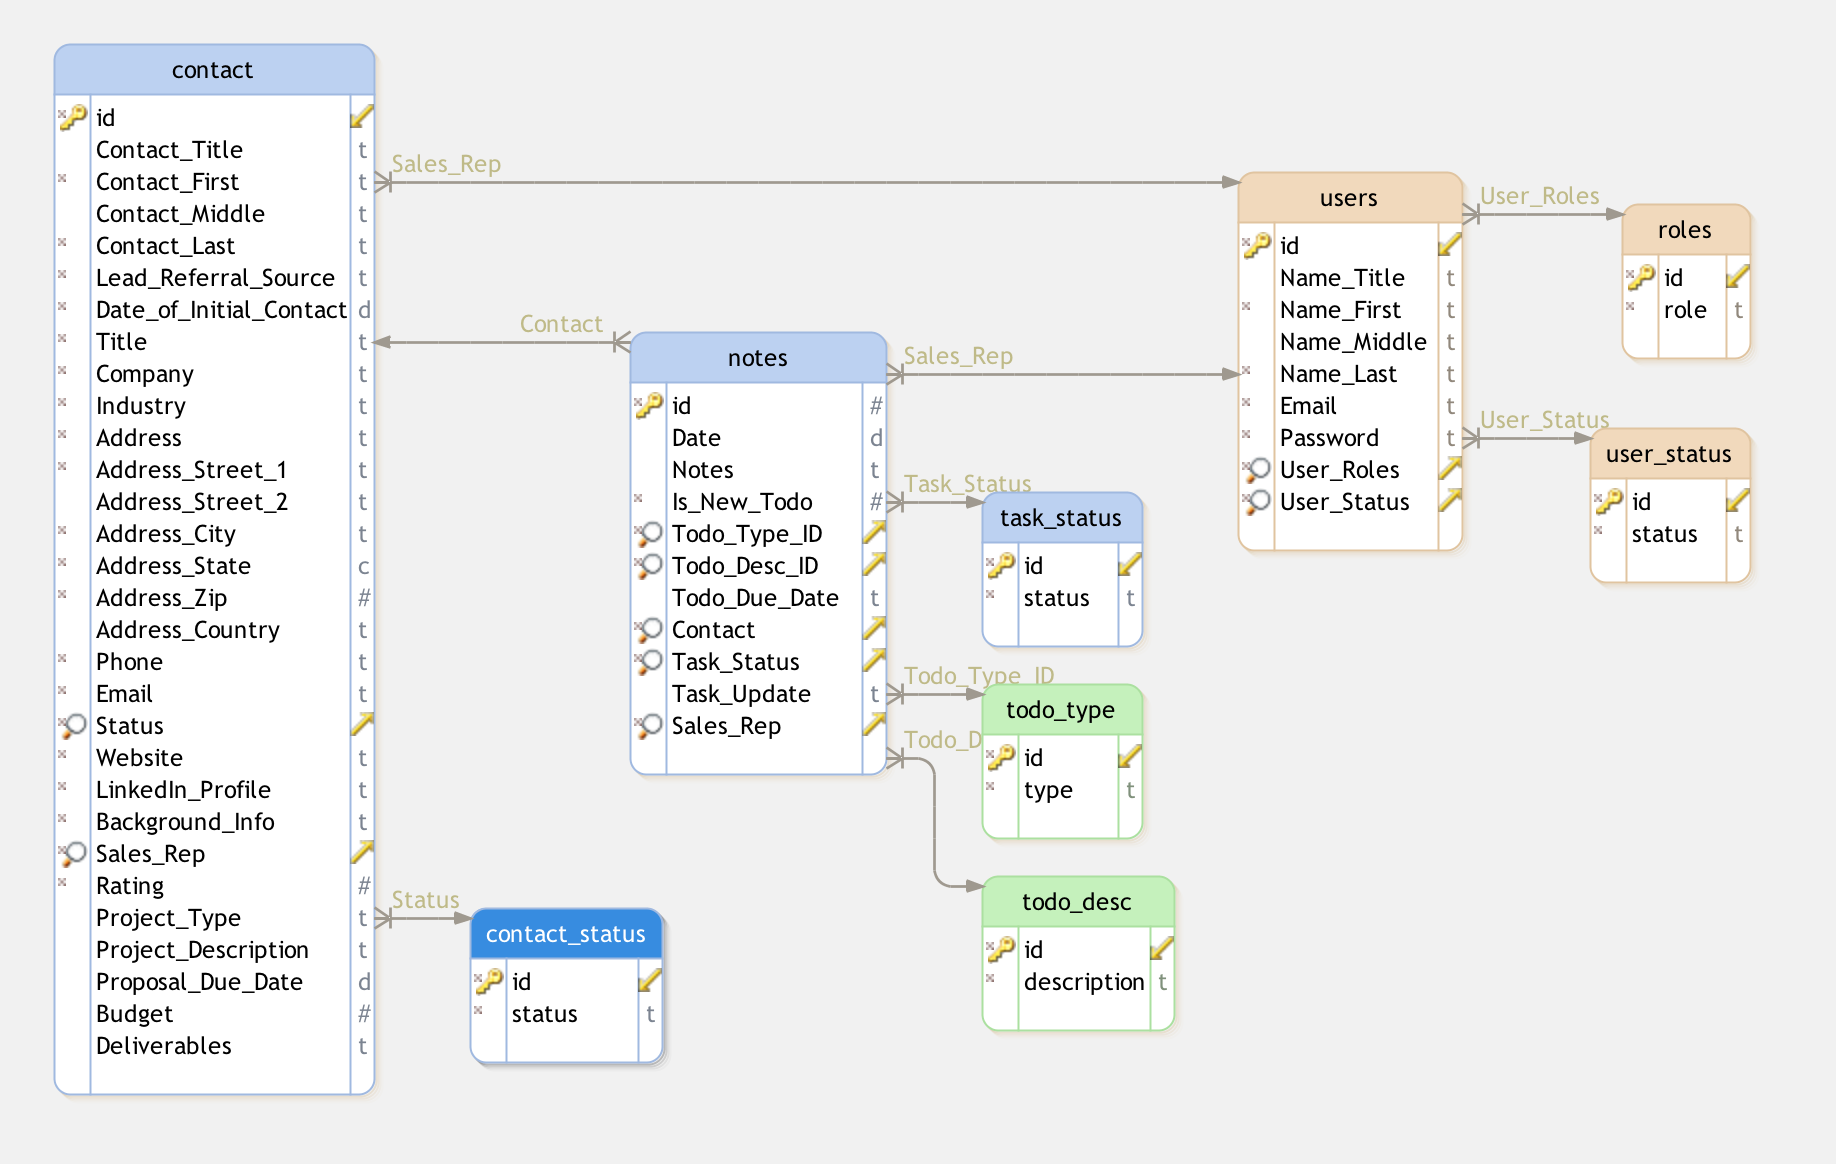
Our database is simple and straightforward. Each table is an entity that represents one of the above objects.
Programming Terminology – Object or Entity
An entity is a database term that’s typically represented by a table in a database schema.
An object is an object-oriental programming term often mapped to a database table.
In our data model, donations is used to store the information about donations; campaigns is used to compile campaign data and information about the campaign; the organization managing the campaign is stored in org.

Set up the Donation Manager Database
Obtain the donation_manager_db.sql SQL script from this tutorial’s GitHub repo, and then execute the SQL script using a MySQL tool such as MySQL Workbench or Sequel Pro. This will create a new database named donation_manager and the tables we will need in this tutorial.
Setup phpGrid
Our simple project management application contains many datagrids. A datagrid is a spreadsheet-like data table that displays rows and columns which representing records and fields stored in the database table. These grids provide the end-user with the ability to read and write to the database tables from a web page.
The phpGrid datagrid component handles all internal database CRUD (Create, Remove, Update, and Delete) operations for us, offering faster and better results with minimal coding.
Be sure to download a free copy of phpGrid before you proceed.
To install phpGrid, follow these steps:
- Unzip the phpGrid download file.
- Upload the phpGrid folder to the phpGrid folder.
- Complete the installation by configuring the conf.php file.
Before we begin coding, we must include the following information in conf.php, the phpGrid configuration file.
1
2
3
4
5
6
| define('PHPGRID_DB_HOSTNAME', 'localhost'); // host name
define('PHPGRID_DB_USERNAME', 'root'); // database user name
define('PHPGRID_DB_PASSWORD', ''); // database password
define('PHPGRID_DB_NAME', 'donation_manager'); // our donation manager database name
define('PHPGRID_DB_TYPE', 'mysql'); // database type
define('PHPGRID_DB_CHARSET','utf8'); // always 'utf8' in MySQL |
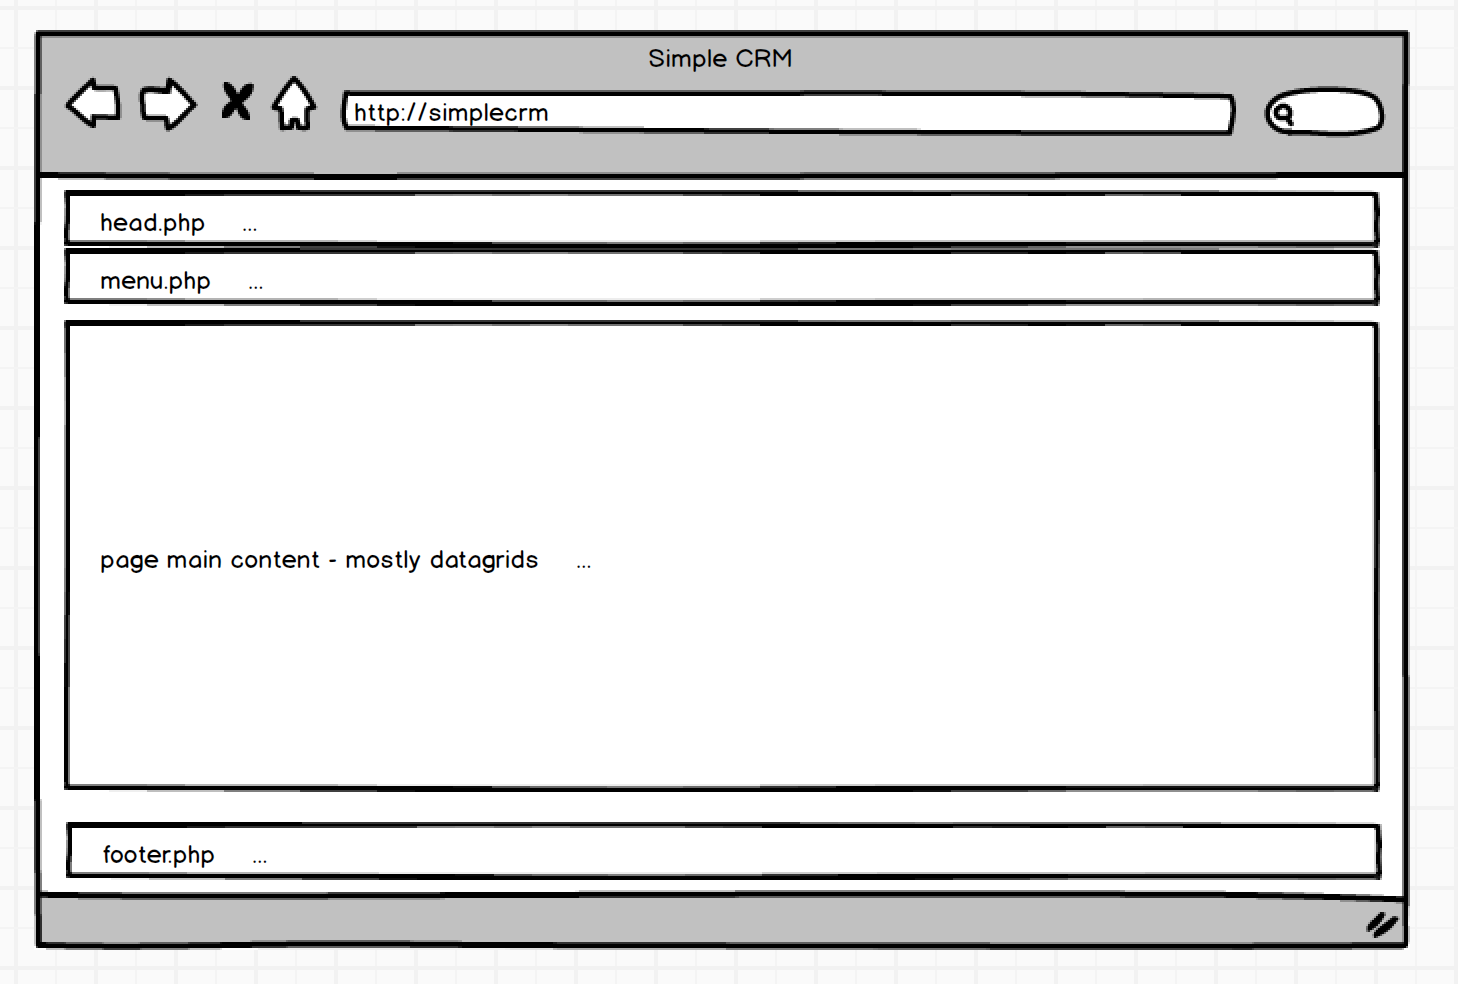
UI Design
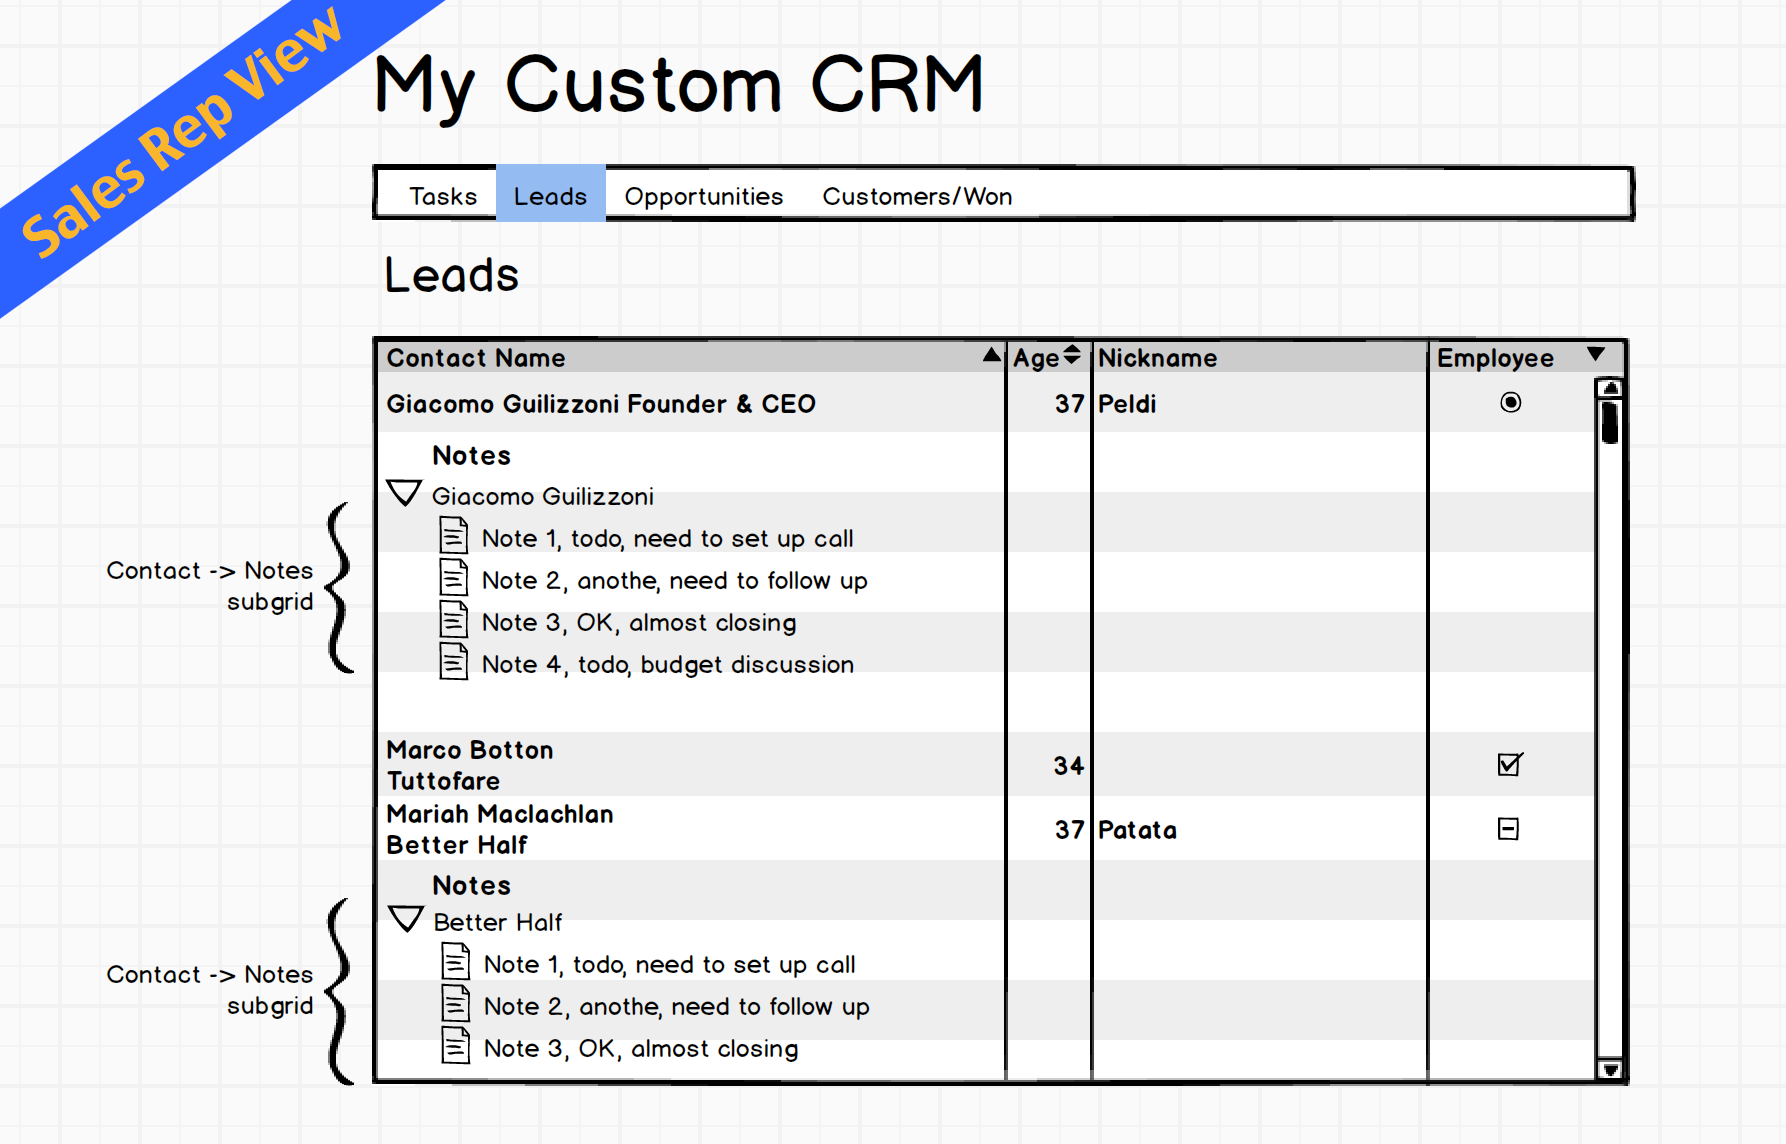
The basic design is simple. It is composed of a single-level top menu bar and a datagrid. In the Reports section, we will add charts using the phpChart.

The Donations Manager has four menu items. Each item represents a corresponding table in the Donation Manager database.
The include file for the menu is stored in the inc folder named menu.php. The code for the menu is straightforward. For the sake of focus, we will not go into great detail. Feel free to look at the content stored inside the inc folder.

We have also added a menu item named Reports which we will address in Part II of this tutorial.
Pages
We will use the same page template we used for the CRM and Project Management tutorials.
Donations
Our first Donation Manager page is the Donations page on which we display donation information retrieved from the Donations table in a datagrid.
Remember that each table in the Donation Manager database has the id as the primary key. So, we can easily create our first datagrid with the following two lines of code.
1
2
| $dgDonations = new C_DataGrid("SELECT * FROM donations", "id", "donations");
$dgDonations -> display(); |
phpGrid 101 – A Basic Datagrid
A basic PHP datagrid requires only as little as TWO lines of code.
- On the first line, you create the phpGrid object to be displayed.
- Then you call display() to render the resulting datagrid on the webpage.
You can learn more about how the basic datagrid works here.
Here’s what our Donations datagrid looks like:

Now, we will make a few enhancements to the Donations datagrid.
First of all, we don’t need to show the Donations primary key id as it is only used internally and is meaningless to our users. We can hide it using set_col_hidden().
1
| $dgDonations->set_col_hidden('id'); |
Next, the Amount column is a currency value. We can format this column to be displayed as currency using set_col_currency().
1
| $dgDonations->set_col_currency("Amount", "$"); |
We also want our datagrid to display a human-readable Campaign description and Donor name instead of displaying meaningless integers in columns CampaignId and DonorId. We can easily obtain the campaign description and donor name from Campaigns and Donors table respectively using the set_col_edittype() function.
1
2
| $dgDonations->set_col_edittype('CampaignId', 'select', 'select id, CampaignName from campaigns');
$dgDonations->set_col_edittype('DonorId', 'select', "select id, LastName from Donors") |
We also want to make the Donations grid editable. We can do this by adding the line:
1
| $dgDonations->enable_edit(); |
The complete code for the Donations datagrid:
1
2
3
4
5
6
7
| $dgDonations = new C_DataGrid("SELECT * FROM donations", "id", "donations");
$dgDonations->set_col_hidden('id');
$dgDonations->set_col_edittype('CampaignId', 'select', 'select id, CampaignName from campaigns');
$dgDonations->set_col_edittype('DonorId', 'select', "select id, LastName from Donors");
$dgDonations->set_col_currency("Amount", "$");
$dgDonations->enable_edit();
$dgDonations -> display(); |
Here’s how the Donations datagrid looks after our enhancements:

Looks good, doesn’t it? Let’s move on!
Donors
The second page is the Donors page. It contains a list of donors and donation summary information.
A one-to-many relationship exists between the table Donors and Donations because one donor can make one or more donations. The Donations table has a foreign-key field donorid which references the Donors table.
We can join both tables, Donors and Donations by using an INNER JOIN to populate our Donations datagrid.
SQL 101 – INNER JOIN
Use an INNER JOIN to create a one-to-many relationship between two database tables. The table on the “one” side of the “one-to-many” relationship should have a primary key column. The other table has a foreign key that points to the primary key in the first table.
Here’s our SQL statement.
1
2
3
4
5
6
| SELECT
d.id,
d.FirstName, d.LastName,
d.Address, d.Email,
FROM donors d
INNER JOIN donations dn ON d.id = dn.donorid |
To make our data look more interesting, we create a full name by concatenating the first name FirstName and last name LastName fields with CONCAT, a SQL function that concatenates two or more strings. In MySQL, it has the following syntax:
1
2
3
4
5
6
7
8
| CONCAT(expression1, expression2, expression3,...)
[cc]
<p>TO CREATE the donor’s FULL name, we also ADD a blank CHARACTER after FirstName, which adds a SPACE BETWEEN the FIRST AND LAST names. </p>
[cc lang="sql"]
CONCAT(d.FirstName, ' ', d.LastName) AS Name |
We also want to display the total amount of donated by a given donor. This is where SQL aggregation functions come in handy. In MySQL, you can use the SUM() function to return the total sum of a numeric column. We name our total TotalDonation.
1
| SUM(dn.Amount) AS 'TotalDonation' |
Because we want to display the summary information, we need to add a GROUP BY statement that groups identical data in the result-set. In this case, we assume that if the Address and Email fields are them same it means they refer to the same donor. The GROUP BY clause groups records into summary rows for each group. It is typically used with aggregate functions such as COUNT, MAX, MIN, SUM, and AVG.
1
| GROUP BY d.Address, d.Email |
Putting it all together, here’s the final SQL statement that we will use to create our datagrid.
1
2
3
4
5
6
7
8
| SELECT
d.id,
concat(d.FirstName, ' ', d.LastName) AS Name,
d.Address, d.Email,
SUM(dn.Amount) AS 'TotalDonation'
FROM donors d
INNER JOIN donations dn ON d.id = dn.donorid
GROUP BY d.Address, d.Email |
Just in case you were wondering about what the d and dn are for in the SQL statement, they are the SQL table aliases.
SQL 101 – Table Alias
SQL aliases are temporary names used for table or column. Aliases are often used to make column or table names more readable. It only exists for the duration of the query.
Donors Datagrid
Below is the code for our Donors datagrid. It is composed of a phpGrid constructor that uses the above SQL statement and the display() function.
1
2
3
4
5
6
7
8
9
10
11
| $dgDonors = new C_DataGrid(
"SELECT
d.id,
concat(d.FirstName, ' ', d.LastName) As Name,
d.Address, d.Email,
sum(dn.Amount) As 'TotalDonation'
FROM donors d
INNER JOIN donations dn on d.id = dn.donorid
GROUP BY d.Address, d.Email ",
"id", "donors");
$dgDonors -> display(); |
Our Donations datagrid looks like this:

Let’s add a few things to improve its usability.
First of all, the first column displays the table’s primary key id. We don’t need to show this to our users. Let’s hide it using the set_col_hidden() function.
1
| $dgDonors->set_col_hidden('id'); |
Each donor has an email. We can easily make this field an email hyperlink using set_col_format().
1
| $dgDonors->set_col_format('Email', 'email'); |
The TotalDonation column is a currency field. We can change this column to currency format using set_col_currency().
1
| $dgDonors->set_col_currency("TotalDonation", "$"); |
And both the Name and TotalDonation fields should be read-only.
1
2
| $dgDonors->set_col_readonly("Name", true);
$dgDonors->set_col_readonly("TotalDonation", true); |
Finally, we make the Donors datagrid editable I(except for the fields we just made read-only) with the enable_edit() function.
1
| $dgDonors->enable_edit(); |
The complete Donors datagrid code:
1
2
3
4
5
6
7
| $dgDonors->set_col_hidden('id');
$dgDonors->set_col_format('Email', 'email');
$dgDonors->set_col_currency("TotalDonation", "$");
$dgDonors->set_col_readonly("Name", true);
$dgDonors->set_col_readonly("TotalDonation", true);
$dgDonors->enable_edit();
$dgDonors->display(); |
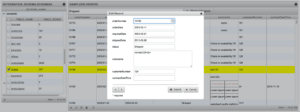
Here’s how the Donors datagrid looks like after the changes (with edit window open).

Donation Detail Grid
As one-to-many relationship exists between table Donors and Donations, we can easily present this relationship using the phpGrid master detail feature.
Datagrid 101 – Master Detail
A one-to-many relationship between two data models can be presented in a master-detail format using datagrids.
The detail grid is a regular phpGrid datagrid object and can use the same methods as any other datagrid such as description title, sort, and update etc. The detail grid is dynamically rendered based on the row selected from the parent (master) grid.
We will simply reuse the code from Donations datagrid we created earlier in this tutorial.
1
2
3
4
5
6
| $dgDonations = new C_DataGrid("SELECT * FROM donations", "id", "donations");
$dgDonations->set_col_hidden('id');
$dgDonations->enable_edit();
$dgDonations->set_col_edittype('CampaignId', 'select', 'select id, CampaignName from campaigns');
$dgDonations->set_col_edittype('DonorId', 'select', "select id, concat(FirstName, ' ', LastName) from Donors");
$dgDonations->set_col_currency("Amount", "$"); |
Note that we did NOT include the last line $dgDonations->display().
Finally, we set the master-detail relationship in our code using set_masterdetails(). The second parameter is the foreign-key defined in the detail table Donations. The third parameter is the foreign-key defined in the master table Donors.
1
| $dgDonors -> set_masterdetail($dgDonations, 'DonorId', 'id'); |
A series of phpGrid master-detail demos and how to use them beyond the scope of this tutorial is also available.
Campaigns
The Campaigns page contains campaign information and donations details. Note that a given campaign can receive many donations from one or many donors. Again, we can use phpGrid’s master-detail feature as we what did on the Donors page.
Let’s start with the Campaigns.
Since the table Campaigns and Donations have a one-to-many relationship, we can join the two tables by creating an INNER JOIN.
1
2
3
| SELECT c.id, dn.CampaignId, c.CampaignName, c.Description, c.StartDate, c.OrgId,
FROM campaigns c
INNER JOIN donations dn ON c.id = dn.CampaignId |
Note that c and dn are the SQL table aliases for the Campaigns and Donations table respectively.
We also want to show the total amount that has been donated to a particular campaign. Again, we can use the SQL aggregation function SUM() to return the total of the Amount column from the Donations table.
1
| SUM(dn.Amount) AS 'TotalDonation' |
One of the key ways to measure the success of a donation campaign, besides the its total amount of donations received, is the total number of the donations. Here, we introduce another useful SQL aggregation function called COUNT().
1
| COUNT(*) AS 'DonationCount' |
The COUNT() function, well, as its name suggests, counts the number of rows returned in a SELECT statement. We give it the name DonationCount.
Lastly, since we want to display the campaign summary information, we will add a GROUP BY statement which will group records and print their totals into summary rows for each group.
1
| GROUP BY dn.CampaignId, c.CampaignName, c.Description, c.StartDate, c.OrgId |
SQL 101 – GROUP BY & Aggregates
Use GROUP BY whenever you need to use the SQL aggregate functions such as COUNT, MAX, SUM, and AVG.
The complete SQL SELECT statement for our Campaigns datagrid looks like this:
1
2
3
4
5
6
| SELECT c.id, dn.CampaignId, c.CampaignName, c.Description, c.StartDate,
COUNT(*) AS 'DonationCount',
SUM(dn.Amount) AS 'TotalDonation'
FROM campaigns c
INNER JOIN donations dn ON c.id = dn.CampaignId
GROUP BY dn.CampaignId, c.CampaignName, c.Description, c.StartDate |
Next, we are going to include a few phpGrid functions to jazz up our Campaigns datagrid.
First of all, as we did with the others, let’s hide the column id.
1
2
| $dgCamp->set_col_hidden('id');
$dgCamp->set_col_hidden('CampaignId'); |
Then, let’s display our TotalDonation field in a currency format.
1
| $dgCamp->set_col_currency('TotalDonation', '$'); |
Don’t forget to make the Campaigns grid editable.
Lastly, we add a global search by adding the function enable_global_search() which enables a multi-fields global search on any searchable columns. That’s all it takes.
1
| $dgCamp->enable_global_search(true); |
That’s it for the Campaigns grid. Let’s take a look:

The complete code for the Campaigns grid:
1
2
3
4
5
6
7
8
9
10
11
12
13
14
| $dgCamp = new C_DataGrid(
"SELECT c.id, dn.CampaignId, c.CampaignName,
c.Description, c.StartDate,
count(*) As 'DonationCount',
sum(dn.Amount) As 'TotalDonation'
FROM campaigns c
INNER JOIN donations dn on c.id = dn.CampaignId
GROUP BY dn.CampaignId, c.CampaignName, c.Description, c.StartDate",
"id", "campaigns");
$dgCamp->set_col_hidden('id');
$dgCamp->set_col_hidden('CampaignId');
$dgCamp->enable_edit();
$dgCamp->enable_global_search(true);
$dgCamp->set_col_currency('TotalDonation', '$'); |
Donations Detail Grid
Remember that we mentioned earlier that the Campaigns and Donations table have a one-to-many relationship? We can present their relationship using the phpGrid master detail feature similar to the way what we did for the Donors and Donations tables.
We will simply reuse the same code we used for the Donations datagrid we made earlier in the tutorial.
1
2
3
4
5
6
| $dgDonations = new C_DataGrid("SELECT * FROM donations", "id", "donations");
$dgDonations->set_col_hidden('id');
$dgDonations->enable_edit();
$dgDonations->set_col_edittype('CampaignId', 'select', 'select id, CampaignName from campaigns');
$dgDonations->set_col_edittype('DonorId', 'select', "select id, concat(FirstName, ' ', LastName) from Donors");
$dgDonations->set_col_currency("Amount", "$"); |
Note that we did NOT include the last line $dgDonations->display().
Finally, we set the master-detail relationship in our code using set_masterdetails(). Campaigns is the master grid, and Donations is the detail grid.
1
| $dgCamp -> set_masterdetail($dgDonations, 'CampaignId', 'id'); |
Thus, the complete code for the Campaigns page is:
1
2
3
4
5
6
7
8
9
10
11
12
13
14
15
16
17
18
19
20
21
22
23
24
25
| $dgCamp = new C_DataGrid(
"SELECT c.id, dn.CampaignId, c.CampaignName, c.Description, c.StartDate,
COUNT(*) As 'DonationCount',
SUM(dn.Amount) As 'TotalDonation'
FROM campaigns c
INNER JOIN donations dn on c.id = dn.CampaignId
GROUP BY dn.CampaignId, c.CampaignName, c.Description, c.StartDate",
"id", "campaigns");
$dgCamp->set_col_hidden('id');
$dgCamp->set_col_hidden('CampaignId');
$dgCamp->enable_edit();
$dgCamp->enable_global_search(true);
$dgCamp->set_col_currency('TotalDonation', '$');
// Donations detail grid
$dgDonations = new C_DataGrid("SELECT * FROM donations", "id", "donations");
$dgDonations->set_col_hidden('id')->set_caption('Donations');
$dgDonations->enable_edit();
$dgDonations->set_dimension('1000px');
$dgDonations->set_col_edittype('CampaignId', 'select', 'select id, CampaignName from campaigns');
$dgDonations->set_col_edittype('DonorId', 'select', "select id, concat(FirstName, ' ', LastName) from Donors");
$dgDonations->set_col_currency("Amount", "$");
$dgCamp -> set_masterdetail($dgDonations, 'CampaignId', 'id');
$dgCamp -> display(); |
This marks the end of the code needed to create the datagrids required for this tutorial. However, we are not done yet. There is still one more page we need to create – Reports. We will cover this section in the Part 2.
Stay tuned!
Run Demo
Download Demo Source Code
First published on Medium.
The post A Step-by-Step Guide to Building a Donation Manager from Scratch in PHP – Part I appeared first on phpGrid.